ADDM has new Spotlight capability in Oracle Enterprise Manager (EM) and Oracle Cloud Infrastructure Operations Insights service (Operations Insights).
For years Automated Database Diagnostic Monitor (ADDM) has provided Oracle Database Administrators with a continuous stream of findings and recommendations for optimizing database and application performance. ADDM analyzes Automated Workload Repository (AWR) performance snapshots as soon as they are created, once per hour (typically), using Oracle's proven time-based performance optimizing methodology.
ADDM findings are statements about database time, the fundamental measure of database performance, and the amount of database time (DB Time) involved is the "impact" of the finding. Similarly, recommendations are actions that can potentially be taken to reduce the DB Time of a given finding, and the amount of time they may save is the "benefit". Findings may have multiple recommendations because there may be more than one way to reduce the DB Time for any given finding.
ADDM Spotlight aggregates these hourly findings and recommendations over longer periods such as a week or month. The longer time window enables DBAs and system administrators to assess the systemic impact of implementing ADDM recommendations over all the workloads serviced by the database. Administrators can weigh the total benefits of big changes against the cost and/or risk of implementation and make better performance management decisions.
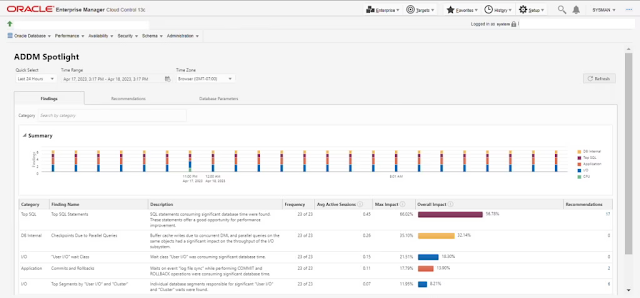
Figure 1: ADDM Spotlight overview in EM
ADDM Spotlight provides performance analysis for a variety of personas
ADDM Spotlight supports database, system, and application administrators in optimizing database application performance.
Database or system administrator capabilities:
◉ Make decisions to upgrade system capacity, such as adding CPU, that may be costly
◉ Gather optimizer statistics on specific sets of tables implicated in performance issues
◉ Prioritize system changes by understanding workload and performance impacts over time
Application administrator capabilities:
◉ Discover poor-performing SQL statements and when they execute
◉ Prioritize SQL tuning efforts based on the total or relative impact of the SQL statement on the application
◉ Identify application design issues causing operations inefficiencies such as a lock or latch contention
The global perspective offered by ADDM Spotlight enables users to make complex and high-impact performance management decisions with confidence.
Rich visualization with in-context drill-downs provides deeper insight into performance
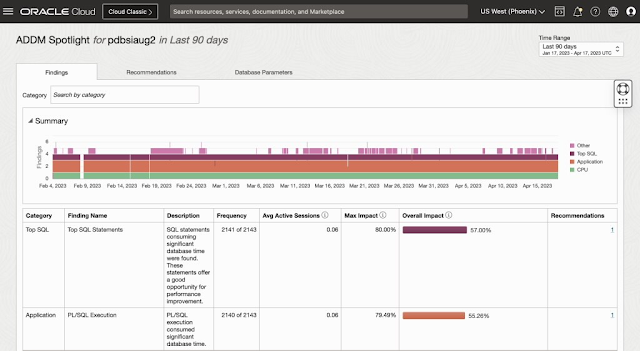
Figure 2: ADDM Spotlight overview in Operations Insights
ADDM Spotlight includes the following key features:
◉ Summary timeline showing when findings and recommendations occur and their volumes
◉ Findings and recommendations tabs that organize findings by category and allow them to be sorted on their aggregated impact or benefit
◉ Database parameters tab to filter and drill down on initialization parameters critical to database performance
The summary timeline shows findings or recommendations aggregated by AWR snapshots over the reporting period. Users can see when specific findings or recommendations occur over time and identify a pattern of database performance issues. The timeline can be filtered to isolate specific findings or recommendations to better identify when and how often they occur.
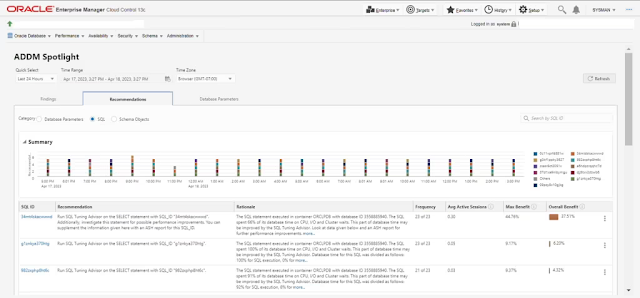
Figure 3: ADDM Spotlight Recommendations page in EM
A key feature in ADDM Spotlight is the Findings and Recommendations tables. These tables present these aggregations by finding or recommendations over the reporting period:
◉ Frequency of occurrence: is this consistently the case or only intermittently?
◉ Average Active Sessions: the total impact or benefit of the finding or recommendation over the entire period measured by the load on the database
◉ Maximum impact or benefit of the finding or recommendation as a percentage of the total workload running at the time when it was observed
These aggregations enable users to decide whether to implement recommendations based on overall severity, peak severity, and whether they address chronic or intermittent issues. For example, ADDM may find the system was overloaded during a specific hour and make a recommendation to add CPU capacity, which will come at a cost. If this finding occurs only once or infrequently then tuning SQL using CPU during that hour may improve performance without the need for additional CPU allocation.
Database parameters tab display initialization parameters over the reporting period. These can have a significant impact on database performance and ADDM may recommend making changes to them. The parameters table can be filtered to zoom into specific parameters with:
◉ High impact on performance
◉ Changes during the reporting period
◉ ADDM recommended changes
◉ Non-default values
ADDM Spotlight is available in EM and Operations Insights
Using EM Cloud Control (EMCC), ADDM Spotlight consolidates the finding and the recommendations that need to be taken into consideration or implemented by looking over the ADDM data of multiple snapshots for an extended period, typically over a week or a day, which provides more justification for implementing the changes that improve the database performance.
Using Operations Insights, the ADDM Spotlight overview page provides a compartment-level view, including child compartments, for your database resources’ ADDM findings. This view enables a quick sort and filter of ADDM results to narrow down the most impactful performance findings and better utilize time to improve the overall performance of your database fleet. ADDM data is stored for up to 25 months in Operations Insights, allowing for larger-scale performance investigations based on seasonality trends.
| OPSI ADDM Spotlight | EM ADDM Spotlight | |
| Retention period | 25 month | ADDM data is retained for 30 days in the database |
| Scope | Fleet-wide or compartment | Single target database |
| Supported versions | PDBs: 19c or higher* Non-PDBs: 18c or higher |
19c or higher |
| Deployment type | Cloud and on-premises, ADB coming soon | Cloud and on-premises |
*Pluggable Databases require a couple of additional configuration steps to begin collecting ADDM data. You must log in to the PDB as a SYS user and set the AWR_PDB_AUTOFLUSH_ENABLED parameter to 'TRUE'. You must also execute the dbms_workload_repository.modify_snapshot_settings to configure snapshot interval collections.
Source: oracle.com


0 comments:
Post a Comment