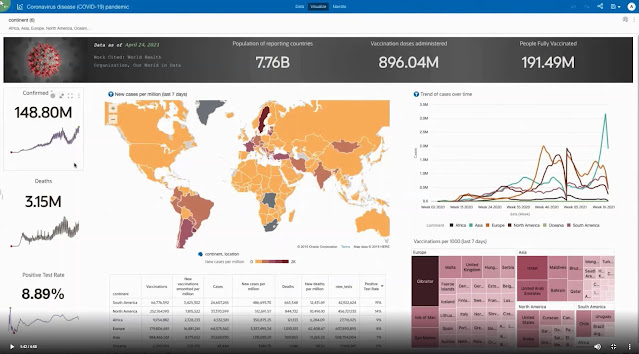
This analysis was conducted in the context of the 2021 Gartner BI Bake-Off. All data used is publicly available, and insights highlighted result from ingesting, preparing, and analyzing that data. This does not represent the opinions of Oracle Corporation and should be used strictly as a demonstration of the Oracle Analytics product line.
More Info: 1Z0-432: Oracle Real Application Clusters 12c Essentials
Every year Gartner invites analytics vendors to present at the Gartner Data & Analytics Summit to show how their products can help solve real-world problems and find insights into real-world data. Last year we looked at life expectancy. As one would expect, our focus this year is on the COVID-19 pandemic. During our analysis phase in March and April 2021, situations changed rapidly. Each day, new data brought new insights, and larger challenges emerged in real-time.
◉ Questions about vaccine safety arose during April 2021
◉ There have been significant increases in disease incidence around the globe, especially in India, starting in the last few weeks of April 2021
◉ Government restrictions are loosening in key geographies as case numbers begin to fall and vaccine administration picks up steam while tightening in others, leading to a patchwork of guidelines within and across countries
We've drawn some conclusions—many that are reflected in what we hear from news sources, but also some that aren’t. Looking at this data in a week or a month may lead to different conclusions that we can’t yet anticipate.
One thing is certain, though: This pandemic has shown gaps in response across and within countries and regions, with socioeconomic factors playing a big role in COVID-19’s relentless spread around the globe.
The phrase “think globally, act locally” is appropriate to the analysis of data about COVID-19 and the vaccines that help combat it. Management of the pandemic has been handled very differently based on geographic, social, political, and economic factors. Here are some insights that we uncovered.
◉ While vaccination rates are increasing throughout Europe, new case counts have been trending upward from February onward. As late as December 2020, it looked like the number of cases was trending lower. Vaccinations started in the UK in late December, but the rollout in the EU has been slower than in other geographies, leading Europe back into a COVID case-number growth curve.
◉ North America is also showing an upward trajectory on COVID cases, but only starting in March 2021. In the US, the highest number of vaccinations given was on April 11. Two days later, safety concerns over one vaccine brand were raised, leading to a lower uptake of vaccines in the US—the vaccine rate has not recovered to the same level in the US since that date.
◉ All geographies are showing an uptick in cases, even as the number of vaccinations climbs. While vaccinations are often viewed as the panacea, the spread of the disease is outpacing the ability to get shots in arms.
◉ High-income and upper-middle-income countries are far ahead in vaccine doses delivered, which is no surprise. But absolute numbers of vaccinations delivered isn’t the key factor in slowing the infection rate. It’s the percentage of the total population getting fully vaccinated—that’s the difference. For example, about 30% of the US is fully vaccinated as of the end of April 2021, whereas, while India has a large number of vaccines administered, only about 3.1% of the population is fully vaccinated.
◉ Just twelve countries make up more than 50% of the vaccines given based on vaccines per million measures.
◉ Governments issued thousands of mandates and actions in an attempt to control the spread of COVID-19. Full lockdown, domestic and international travel restrictions and social distancing (including school closures) in aggregate had the biggest influence on the spread of the disease across many countries in EMEA and South America. Responses to government actions were different by country.
These are just some of the highlights we saw, but this is by no means an exhaustive list.
◉ Belgium and the UK saw a greater positive impact from lockdown, Argentina and France less so. The first question that comes to mind is “why?” There’s nothing in the data we could find to support different responses by country. But citizens of those countries often point to anecdotal cultural attitudes that may or may not validate the relative impact of lockdowns.
◉ Social distancing guidelines were not effective in France but were far more effective in Israel.
◉ US results overall weren’t promising in any action as mandates didn’t have desired impacts, especially in the second half of 2020. While we did some drilling down into different states and how they responded, there were markedly different responses based on states and regions. As mandates were set by both states and the federal government, aggregating at the US level did not give clear conclusions.
◉ The conclusion we draw from all this: One-size mandates don’t fit all countries and regions. What works in London may not work in Lyon. What works in the northeast USA may not work in the southwest USA. Mandates must be tried and tailored to the geography and the situation on the ground to be effective.
Tweets about COVID and vaccines are largely neutral to positive. The larger the reach (how many people may be influenced), the more neutral they are. When analyzing Twitter data about specific vaccine brands, there is some variability in tone (positive, neutral, negative) but not enough to say if it’s impacting vaccine hesitancy. As we enter the next phase of vaccinations worldwide, a “charm campaign” may be needed to get past vaccine hesitancy. Tweets from influencers with large reaches may be one avenue to help sway people to get vaccinated.
Source: oracle.com


0 comments:
Post a Comment