The Business Case
Customers of Oracle Fusion Analytics Warehouse (Fusion Analytics) often need analytics to answer key questions about performance and to uncover poor performance or gaps, such as:
◉ Opportunities where there are no activities in the last year
◉ Opportunities with no associated revenue lines
◉ Opportunities with no service requests
To do this, customers need to know what data is not available, for these scenarios and others.
The Dilemma
Each scenario involves the non-occurrence of a business event, or the absence of data, and are therefore not available in the ready-to-use subject areas. While this need is true for all Fusion Analytics offerings, this article describes a solution for the Fusion Customer Experience (CX) Analytics offering.
The Approach
The following steps explain how you can resolve the dilemma and enrich your Fusion Analytics experience:
1. Analyze the data scenarios.
2. Create a universal dataset.
3. Curate individual datasets for each scenario.
4. Define and create the join between the datasets.
5. Validate and test the scenarios.
1. Analyze the data scenarios
Analyze each scenario and map it to a subject area using the product documentation. The results are shown in the following map:
| No | Business Question | Corresponding Subject Areas |
| 1 | Opportunities with no activities in the last year | CX - Opportunity Activity, CX - Opportunity |
| 2 | Opportunities with no revenue lines | CX - Opportunity Revenue Line, CX - Opportunity |
| 3 | Opportunities with no service requests | CX - Service Request, CX - Opportunity |
2. Create a universal dataset
◉ Log into Fusion Analytics and navigate using the left-hand navigation pane to Data.
◉ Click the Datasets tab if necessary.
◉ Click Create and then Dataset as shown below:
Because your aim is a cross-subject area join, select the Local Subject Area option.
The local subject areas are displayed. Select the CX – Opportunity, CX – Opportunity Activity, CX - Opportunity Revenue Line, and CX - Service Request subject areas and drag and drop them to the right pane, as shown in the following figure:
You see five tabs. The first is Join Diagram, where you can define the join conditions between the various subject areas. These ready-to-use subject areas are comprehensive and have many tables and rows. Joining them results in poor performance that outweighs any benefits. Thus, first limit your dataset using the other four tabs.
3. Curate individual datasets for each scenario
To simplify a subject area, select only the applicable folders and attributes.
Click the CX – Opportunity tab
◉ Select the highlighted folders and on the right pane, set the Data Action property to Automatic Caching. This dataset has all the opportunities available in the system, so name it: All Opportunities. Use clear and concise names for multi-dataset models.
Click the CX - Opportunity Activity tab
To identify opportunities with no activity in the last year, create a filter condition: Activity Created Date between CURRENT_DATE-365 and CURRENT_DATE and # Of Opportunity Activities =0. Name this dataset: No_Activity_Last_One_Yr.
Click the CX - Opportunity Revenue Line tab
After simplifying the subject area, use a filter condition: Opportunity Line Revenue =0 or Opportunity Line Revenue is NULL. This dataset includes all opportunities without revenue lines, so name it: No_Rev_Line.
Click the CX - Service Request tab
After simplifying the subject area, use a filter condition: # Of SRs =0. This dataset includes all the opportunities with no service requests, so name it: No_Service_Req.
4. Define joins between the datasets
To build visualizations, pull opportunity data from the All Opportunities dataset, and get the remaining data from the others.
Start by defining joins between each of the four datasets. The All Opportunities dataset is left-outer-joined to the three filtered datasets.
First, create a join between All Opportunities and No_Rev_Line.
Then create a join between All Opportunities and No_Service_Req.
Next, create a join between All Opportunities and No_Activity_Last_One_Yr.
The overall dataset join diagram appears as follows:
5. Validate and test the scenarios
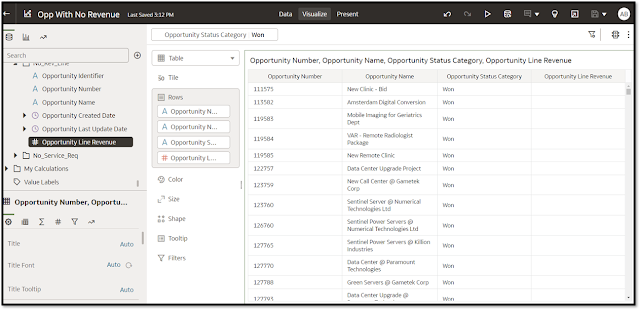
Create reports for the various scenarios to test the dataset joins and conditions. Select opportunity data from All Opportunities and the Opportunity Line Revenue attribute from the No_Rev_Line dataset. The resulting report gives you Opportunities with no revenue lines, which is scenario #2 from the introduction to this article.
Follow this method to create and confirm the other scenarios.
Source: oracle.com


0 comments:
Post a Comment