Note: This is a two-part blog. Part 1 discusses the concepts of building an autoscaling script, and part 2 covers a proof of concept, with some code snippets and test results.
In part one of this blog, we discussed the concepts involved in building an autoscaling script to control the OCPUs provisioned to an Exadata Cloud Service system. In this part, we will build a proof-of-concept Python3 script to demonstrate how to autoscale such a system. In this case, we have provisioned an ExaCS Base System. The base system consists of two physical servers, each of which can support a VM with between 2 and 24 cores. Using OCI CLI, we will scale the two-node cluster on the system between 4 OCPUs (2 x 2 cores) and 48 OCPUs (2 x 24 cores). The autoscale script will measure CPU utilization across the nodes in the cluster, interpret the measurements, and, if necessary, scale the OCPUs up or down.
These code snippets are for demonstration purposes only and are not production-ready. They have no error handling and pause action if any nodes are down. A production script could also be optimized to take measurements across the nodes in parallel. Oh, and since these snippets are from a script, let’s start with the legal disclaimers:
### -------------------------------------------------------------------
### Disclaimer:
###
### EXCEPT WHERE EXPRESSLY PROVIDED OTHERWISE, THE INFORMATION, SOFTWARE,
### PROVIDED ON AN \"AS IS\" AND \"AS AVAILABLE\" BASIS. ORACLE EXPRESSLY DISCLAIMS
### ALL WARRANTIES OF ANY KIND, WHETHER EXPRESS OR IMPLIED, INCLUDING, BUT NOT
### LIMITED TO, THE IMPLIED WARRANTIES OF MERCHANTABILITY, FITNESS FOR A PARTICULAR
### PURPOSE AND NON-INFRINGEMENT. ORACLE MAKES NO WARRANTY THAT: (A) THE RESULTS
### THAT MAY BE OBTAINED FROM THE USE OF THE SOFTWARE WILL BE ACCURATE OR
### RELIABLE; OR (B) THE INFORMATION, OR OTHER MATERIAL OBTAINED WILL MEET YOUR
### EXPECTATIONS. ANY CONTENT, MATERIALS, INFORMATION OR SOFTWARE DOWNLOADED OR
### OTHERWISE OBTAINED IS DONE AT YOUR OWN DISCRETION AND RISK. ORACLE SHALL HAVE
### NO RESPONSIBILITY FOR ANY DAMAGE TO YOUR COMPUTER SYSTEM OR LOSS OF DATA THAT
### RESULTS FROM THE DOWNLOAD OF ANY CONTENT, MATERIALS, INFORMATION OR SOFTWARE.
###
### ORACLE RESERVES THE RIGHT TO MAKE CHANGES OR UPDATES TO THE SOFTWARE AT ANY
### TIME WITHOUT NOTICE.
###
### Limitation of Liability:
###
### IN NO EVENT SHALL ORACLE BE LIABLE FOR ANY DIRECT, INDIRECT, INCIDENTAL,
### SPECIAL OR CONSEQUENTIAL DAMAGES, OR DAMAGES FOR LOSS OF PROFITS, REVENUE,
### DATA OR USE, INCURRED BY YOU OR ANY THIRD PARTY, WHETHER IN AN ACTION IN
### CONTRACT OR TORT, ARISING FROM YOUR ACCESS TO, OR USE OF, THE SOFTWARE.
### -----------------------------------------------------------------------------------------------
### This tool is NOT supported by Oracle World Wide Technical Support.
### The tool has been tested and appears to work as intended.
### -----------------------------------------------------------------------------------------------
Install OCI CLI into a VM
There are good instructions on how to install the OCI CLI on a server. Refer to https://docs.oracle.com/en-us/iaas/Content/API/Concepts/cliconcepts.htm for detailed instructions. The VM will need network access to the control plane and ssh access to the ExaCS.
Configuration Parameters
Our script loads the following parameters from a JSON file. These control the behavior of the autoscale operation and identify the cluster we are managing.
◉ compartmentID is the compartment OCID and can be found in the OCI console under the Identity->Compartments menu item
◉ highTarget is the upper bound of the CPU utilization target range
◉ lowTarget is the lower bound of the CPU utilization target range
◉ interval determines how many seconds we sleep after each cycle
◉ keepMeasurements determines how many measurement cycles must violate the target range before we take action
◉ maxCoresPerVM is a physical limit on the number of cores per VM we will scale to
◉ minCoresPerVM is the minimum size of a VM—for Exadata VMs this is at least 2 cores
◉ measureDuration is the time in seconds we average CPU utilization over to get each measurement
◉ vmClusterID is the VM Cluster OCID and it identifies the cluster we are managing. It can be found from the console on the VM Cluster details page
◉ scaleDownDelay is the time in seconds that autoscaling will wait after the CPU utilization has stabilized before any future scale down operations will be initiated
For our POC, we simply stored the configuration parameter in a Python dictionary, but you could also load these from a json file.
params = {
"compartmentID": "ocid1.compartment.oc1..xxxxxxxxxxxx",
"highTarget": 70,
"historyFile": "autoscale.csv",
"interval": 60,
"keepMeasurements": 3,
"lowTarget": 60,
"maxCoresPerNode": 24,
"measureDuration": 1,
"minCoresPerNode": 2,
"vmClusterID": "ocid1.cloudvmcluster.oc1.eu-frankfurt-1xxxxxxxxxxxxxxxx",
"scaleDownDelay" : 7200
}
Script Basics
The script is a loop that measures the CPU utilization, interprets the measurement, and, if necessary, scales the VMs in the cluster. The VMs are scaled together—each is always configured with the same number of OCPUs. Note, we don’t perform any measurements if the cluster is not in the “AVAILABLE” state. For example, if the cluster is updating the size of the VMs, we will skip taking measurements until it completes.
Below is a sample loop as described:
import subprocess,json,collections,time,datetime
avgMeasureList = collections.deque([]) #This is a FIFO queue to contain the latest
#<keepMeasurements> CPU Utilization measurements
waitUntil=0 #Earliest time to consider a scale down operation. 0 = scale immediately
#get list of VMs and their IP addresses
hostList=get_host_list(params)
while True:
#get number of cores per the control plane.
#If cluster lifecycle-state != "AVAILABLE", #cores = 0
cpCores = get_cp_cores(params)
#if cluster lifecycle-state != "AVAILABLE" (cpCores=0), then skip operations and sleep
if cpCores > 0:
#get VM statistics, update average CPU history, return measured cores
totCores=update_vm_stats(hostList,avgMeasureList,params)
#if total cores measured != expected per control plane, skip operations and sleep
if totCores == cpCores:
cpuState=interpret_measurement(avgMeasureList,params)
#if measurements out of target band, scale cluster
if cpuState in ["High","Low"]: scale_cluster(totCores,cpCores,
cpuState,hostList,avgMeasureList,params)
#if cpu meeting target, then set the scaleDownDelay timer to 2 hours
elif cpuState == "OK": waitUntil=time.time()+params["scaleDownDelay"]
time.sleep(params["interval"])
Create List of Hosts in the Cluster
The only input to identify the cluster we manage is the VM Cluster OCID. From that, we can determine the nodes (VMs) that are part of the cluster and how to reach them (IP Addresses). The script uses OCI CLI to read a list of nodes in the cluster, and then calls another OCI CLI command for each node to get the hostname and IP address. This allows us to easily get the connection information for each node without having to add that information as parameters.
The following code snippets is used to return the list of hosts in the cluster. This is called by the main loop:
# gets the list of hostnames and IP addresses that make up the cluster.
def get_host_list(params):
hostList=[]
#Run OCI CLI command to list the nodes in the VM cluster
ociCmd = "oci db node list --compartment-id %s --vm-cluster-id %s" \
%(params["compartmentID"], params["vmClusterID"])
nodeList = json.loads(subprocess.check_output(ociCmd, shell=True))["data"]
for node in nodeList:
vnicID = node["vnic-id"]
#Run OCI CLI command to get information on each vnic
ociCmd = "oci network vnic get --vnic-id %s" %vnicID
vnic = json.loads(subprocess.check_output(ociCmd, shell=True))["data"]
#append to the hostlist a dictionary containing the hostname and IP address of the node
hostList.append({"hostname":vnic["hostname-label"],"IP":vnic["public-ip"]})
return hostList
Check State of Cluster
With the list of hosts in the cluster, we can see what the control plane believes is the state of the cluster. This is optional but can catch conditions where the control plane is out of sync.
#Call OCI CLI to get the current number of cores configured for the cluster
def get_cp_cores(params):
ociCmd = "oci db cloud-vm-cluster get --cloud-vm-cluster-id %s" %params["vmClusterID"]
clusterState = json.loads(subprocess.check_output(ociCmd, shell=True))["data"]
if clusterState["lifecycle-state"] != "AVAILABLE":
cpCores = 0 #set cores to zero if cluster not in AVAILABLE state
else: cpCores = clusterState["cpu-core-count"]
return(cpCores)
Measure CPU Utilization
Now, it’s time to measure CPU utilization. When taking CPU utilization measurements, we store the average of all nodes and store those measurements in a FIFO queue. The parameter “keepMeasurements” determines how many measurements to keep in the queue. We also read directly from the VM to validate the size of each VM and compare the sum of the VM sizes with what the control plane specifies as the total number of OCPUs. If those two numbers are different, something has failed or is out of sync and we skip to the next cycle without analyzing the measurements or performing any scaling operations. Using the average utilization across all nodes assumes the workload is spread evenly across the system. If that is not true in your case, you should use a different algorithm for measurements.
We start by measuring utilization. The main loop calls this function to get the utilization for all VMs in the cluster:
#adds the average CPU usage across nodes in the cluster to a FIFO queue and
#returns the # cores measured as active in the cluster
def update_vm_stats(hostList,avgMeasureList,params):
totCores=0
sumCPU=0
measureCount=0
for hostDict in hostList: #iterate through nodes in cluster
cpuUtil,cores=get_host_cpu_util(hostDict["IP"],params["measureDuration"])
hostDict["cores"]=cores
totCores=totCores+cores #count actual cores in cluster
if cpuUtil > 0:
sumCPU = sumCPU + cpuUtil
measureCount = measureCount+1
avgMeasureList.append(sumCPU/measureCount)
if len(avgMeasureList)>params["keepMeasurements"]:
avgMeasureList.popleft()
return(totCores)
And this function calls another function to get the utilization on any one server. This uses mpstat as described in part 1 of this blog:
#for a given IP Address, measures the average CPU over a specified interval
def get_host_cpu_util(hostIP,measureDuration):
shellCmd="ssh opc@%s mpstat %d 1" %(hostIP,measureDuration)
mpstatOut=subprocess.check_output(shellCmd, shell=True).decode()
mpstatList=mpstatOut.splitlines()
for line in mpstatList:
if line[0:5]=="Linux":
cores=int(line.split()[-2].strip("("))/2
elif line[0:8]=="Average:":
cpuUtil=100-float(line.split()[-1])
return(cpuUtil,int(cores))
Interpret the Measurements
The script interprets the measurements by looking at the measurements in the queue, and, if all are high or low, declaring CPU either high or low. If any of the measurements are within range, we declare the CPU utilization within the target range and don’t perform any action. Basing the decision on multiple measurements from different cycles prevents action on transient readings. The queue is emptied after a script restart, or after a cluster update operation. We don’t interpret the measurements unless the queue is full of measurements.
This snippet interprets the measurements:
#reads the average measurements in the queue and decides if utilization is high, low, or OK
def interpret_measurement(avgMeasureList,params):
#if we don't have measurement queue full, return "Init"
if len(avgMeasureList) != params["keepMeasurements"]: return("Init")
cpuState="New"
for avg in avgMeasureList:
if avg > params["highTarget"] and cpuState in ["New","High"] : cpuState = "High"
elif avg < params["lowTarget"] and cpuState in ["New","Low"] : cpuState = "Low"
else: cpuState = "OK"
if cpuState == "Low" and time.time()< waitUntil: cpuState="Scale Down Delayed"
return(cpuState)
Scale the Cluster
If the measurements are high or low, we then scale the cluster up or down to compensate. We attempt to calculate a target OCPU count based on the effective cpus in use (# cores x utilization) divided by the desired utilization. However, that new OCPU target is adjusted to ensure the new value increments or decrements by at least 1 OCPU per node (so as to not remain stuck in an out of target condition), and to conform to the minimum and maximum values specified in the parameter file. This works well unless you suddenly increase the load and the CPU utilization goes to 100%, in which case it may take a few iterations to catch up. The scaleDownDelay parameter will instruct the system to wait scaleDownDelay seconds before lowering the OCPUs. This delay only takes effect after the CPU utilization has stabilized into the target range.
If we need to scale the cluster, we need to make a guess as to how much to scale.
#Estimate the number of cores to meet the CPU utilization target based
#on current actual cores and CPU utilization
def get_target(totCores,avgMeasureList,numNodes,params):
cpuUtil=sum(avgMeasureList)/len(avgMeasureList)
targetUtil = (params["highTarget"]+params["lowTarget"])/2
targetCores = round(totCores * cpuUtil/targetUtil/numNodes)*numNodes
return(targetCores)
And using that information, we can use oci cli to scale the cluster:
#scale the cluster taking into account minimum and maximum core counts
def scale_cluster(totCores,cpCores,cpuState,hostList,avgMeasureList,params):
numNodes=len(hostList)
minCores=max(2,params["minCoresPerNode"])*numNodes
maxCores=params["maxCoresPerNode"]*numNodes
#get estimate of number of cores to meet utilization target
targetCores=get_target(totCores,avgMeasureList,numNodes,params)
#adjust target to account to scale at least one core per node
if cpuState == "High": targetCores=max(cpCores+numNodes,targetCores)
elif cpuState == "Low": targetCores=min(cpCores-numNodes,targetCores)
#adjust new core count to conform to min/max limits
newCores=max(min(targetCores,maxCores),minCores)
if newCores != cpCores: #not already at min or maximum"
#scale the vm cluster
ociCmd="oci db cloud-vm-cluster update --cloud-vm-cluster-id %s \
--cpu-core-count %d" %(params["vmClusterID"],newCores)
retVal = json.loads(subprocess.check_output(ociCmd, shell=True))["data"]
#clear avgMeasureList history as measurements no longer valid
for i in range(0,len(avgMeasureList)): avgMeasureList.pop()
After every cycle the script pauses for a number of seconds. Since measurements are taken across multiple cycles, the longer this pause, the slower the script is in responding to load changes.
Generate Load
Ideally, we would generate a database workload against databases running in the Exadata. However, to keep in simple, we just use a cpu_hog program installed in the ExaCS VM to generate load. This simple program is single-threaded (adds two numbers in a loop), and by spinning up multiple processes we can drive additional load on the system. Load is generated symmetrically across all nodes in the cluster by running the same number of cpu_hog processes on each node.
Results
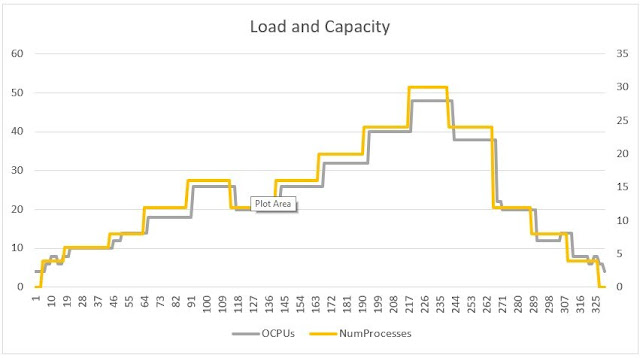
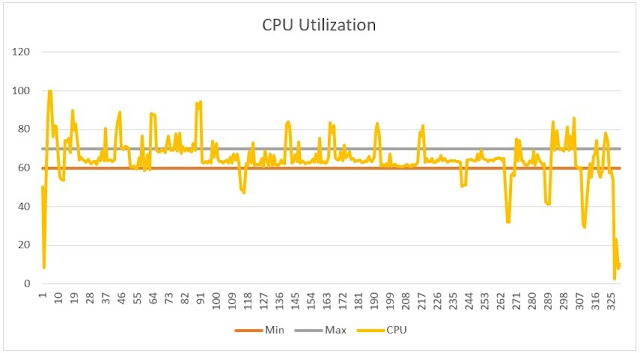
We tested the autoscale script on an ExaCS Base System. Figure 1 below shows the results of a test run (with scaleDownDelay set to 0). We varied the load every 15 minutes, between 0 and 30 processes per node in a base system. The yellow line represents the load in processes per node, and the gray line is the OCPU count across all nodes. In Figure 2, we plot CPU utilization over the same time period. The gray and orange lines mark the target range configured. As you can see, the CPU utilization largely remains in the target range except immediately after changes in load.


0 comments:
Post a Comment