When speaking at conferences or talking to customers about Database In-Memory one of the things that I usually point out is that the fastest Database In-Memory query is the one that does all of the query work during the scan of the table or tables. With this post I wanted to expand a bit more on this theme and show an example of how single table group by processing can also benefit from the ability to push the group by aggregation processing into the table scan in the IM column store.
In the following example I'm going to query just the LINEORDER table which is the fact table from the SSB schema that we use for most of our blog examples. The query is the following:
SELECT l.lo_shipmode, sum(l.lo_revenue - l.lo_supplycost) profit
FROM lineorder l
WHERE l.lo_shipmode IN ('SHIP','TRUCK')
GROUP BY l.lo_shipmode
ORDER BY l.lo_shipmode
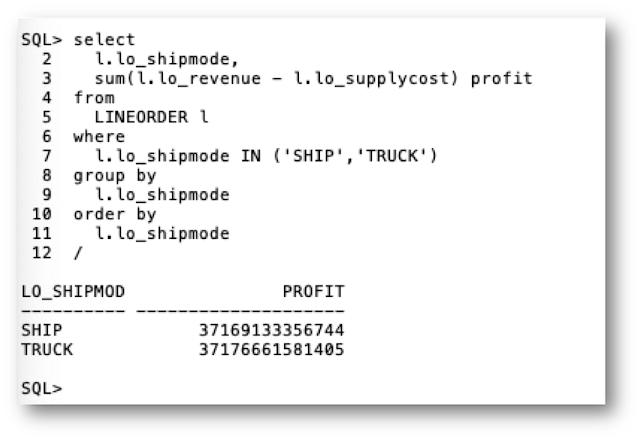
When I run this query I get the following result:
The following execution plan shows that the optimizer chose an inmemory plan (i.e. TABLE ACCESS INMEMORY FULL) and that it was going to push the filter predicate (i.e. l.lo_shipmode IN ('SHIP','TRUCK')) into the in-memory scan. See the previous push down blog entries I mentioned earlier for more details about how that works. However, we don't see anything about any group by optimizations in the execution plan.
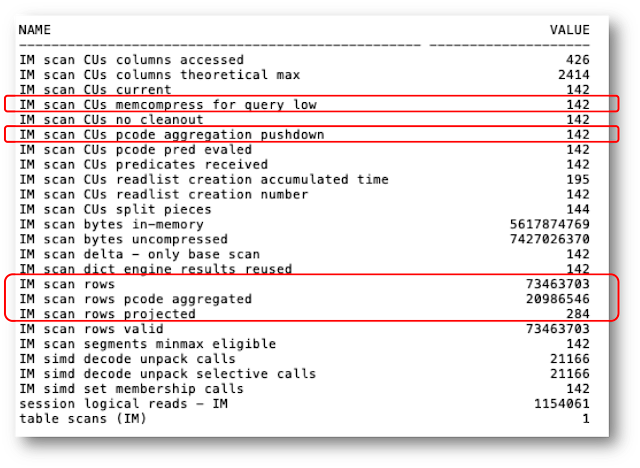
If we look at the session level statistics though, we can see some interesting things going on with Database In-Memory. I have included all of the non-zero IM related session level stats below:
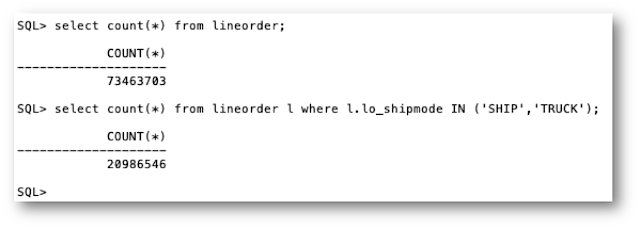
Several of these stats give us information about how much aggregation work was done during the scan. I have highlighted some key statistics. For further information I ran two additional queries to show the total rows in the table and the total rows after applying the filter predicate:

The statistic "IM scan CUs memcompress for query low" tells us that there are 142 IMCUs populated for the LINEORDER table. We also see a statistic called "IM scan CUs pcode aggregation pushdown". This tells us that the aggregation pushdown was applied to all 142 IMCUs. More interesting though is that we see that the "IM scan rows" statistic matches the total number of rows in the table (i.e. 73,463,703) and that the rows aggregated, "IM scan rows pcode aggregated", matches the rows left after applying the filter predicate (i.e. 20,986,546). Let me reiterate that this is showing us that the filter predicate was applied during the scan, a big deal by itself, and that we only aggregated those filtered rows. Finally, we see that we returned only 284 "rows" based on the statistic "IM scan rows projected". You might ask why 284 and not 142, which is the number of IMCUs? Notice that we returned two aggregate totals in the results of the query and 2 x 142 = 248. This is just an implementation detail in processing the columnar results and returning them back to the invoking SQL query. The bottom line is that we returned only 284 rows versus the 20,986,546 which is what we would have had to return if we hadn't been able to do the aggregation as part of the in-memory scan. A pretty significant improvement and one of the many ways that Database In-Memory is able to provide orders of magnitude faster analytic query performance.


0 comments:
Post a Comment