The Active Session History (ASH) was introduced in Oracle 10g to provide real-time diagnostics information. ASH Analytics is a feature of Enterprise Manager Cloud Control 12c, which visualises ASH information, making it even simpler to diagnose performance problems.
ASH requires the Diagnostics and Tuning option in Enterprise Edition.
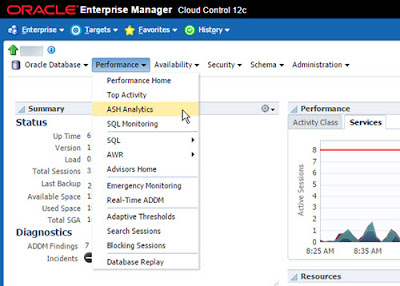
Once you've navigated to a database target, the "ASH Analytics" menu will be available under the "Performance" section.
ASH requires the Diagnostics and Tuning option in Enterprise Edition.
Once you've navigated to a database target, the "ASH Analytics" menu will be available under the "Performance" section.
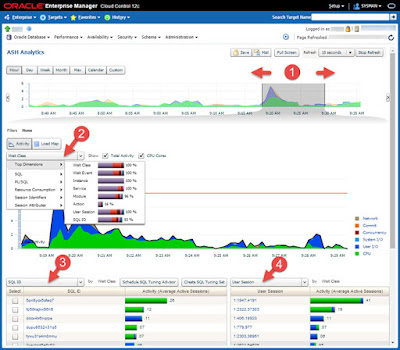
1. On the top-left of the page you will see buttons to quickly alter the monitoring period displayed in the overview graph.
2. The greyed out, selected, area of the activity graph is expanded into a more detailed activity graph below.
3. All the screens under the ASH Analytics section can be saved or emailed by pressing the relevant button.
1. The edges of the selection on the overview graph can be repositioned by dragging them with your mouse. The expanded activity graph will refresh to match your selection.
2. The dropdown allows you to alter the contents of the expanded activity graph.
3. The dropdown allows you to customise the contents of this detail section.
4. The dropdown allows you to customise the contents of this detail section.
The dropdowns contain the following metrics.
◈ Top Dimensions : Wait Class, Wait Event, Instance, Service, Module, Action, User Session, SQL ID
◈ SQL : SQL ID, Top Level SQL ID, SQL Force Matching Signature, SQL Plan Hash Value, SQL Plan Operation, SQL Plan Operation Line, SQL Opcode, Top Level SQL Opcode
◈ PL/SQL : PL/SQL, Top Level PL/SQL
◈ Resource Consumption : Wait Class, Wait Event, Object, Blocking Session
◈ Session Identifiers : Instance, Service, User Session, Parallel Process, User ID, Program, Session Type
◈ Session Attributes : Consumer Group, Module, Action, Client, Transaction ID, Execution Context ID
1. Hovering over the expanded activity graph will highlight the section you are above. Clicking it will apply a filter and redraw the graph based on that filter.
2. The filter can be removed by click the "X" on the filter.
1. Clicking the "Load Map" button will redraw the activity as a load map.


0 comments:
Post a Comment